-
Model estimated solar radiation for 1961-1990 (W/m²)
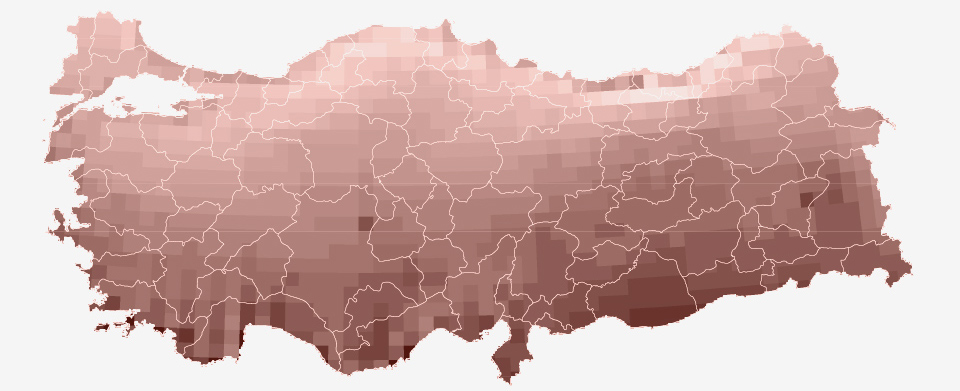 148-165 186-189 201-204 216-219 227-230 242-255
-
Model estimated solar radiation for 2041-2070 (W/m²)
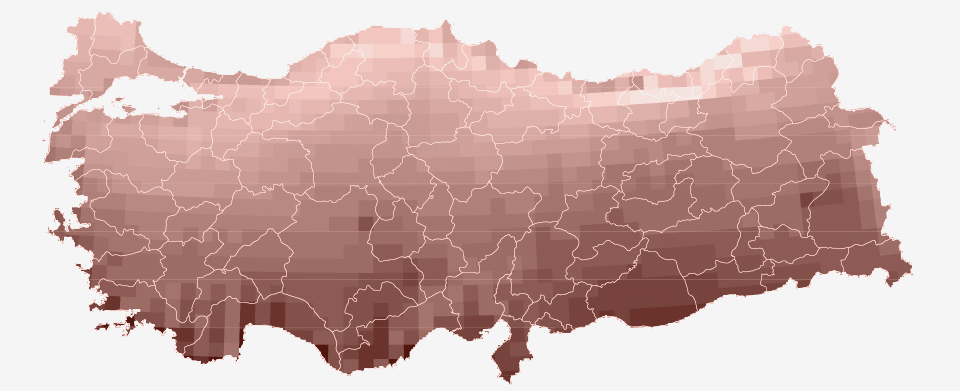 148-165 186-189 201-204 216-219 227-230 242-255
-
Model estimated solar radiation for 2071-2099 (W/m²)
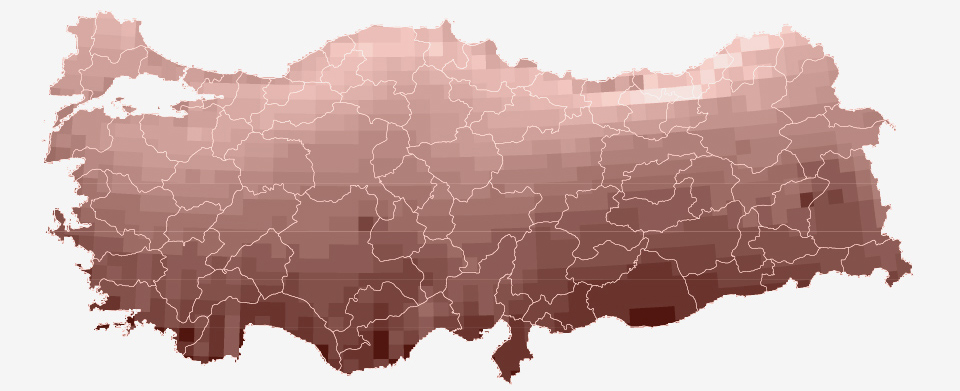 148-165 186-189 201-204 216-219 227-230 242-255
Radiation
These maps show the model-estimated mean annual solar radiation distribution in Turkey for three different periods 1961-1990, 2041-2070, and 2071-2099. The 1961-1990 map shows a slight gradual decrease in the solar radiation from the southern latitudes of Turkey to the northern latitudes.
Comparison of future maps with the 1961-1990 map indicates that the solar radiation will to some extent increase in a large part of Turkey. Changes can be clearly observed in the change maps of (1961-1990) - (2041-2070), and (1961-1990) - (2071-2099).