-
Model estimated precipitation for 1961-1990 (mm)
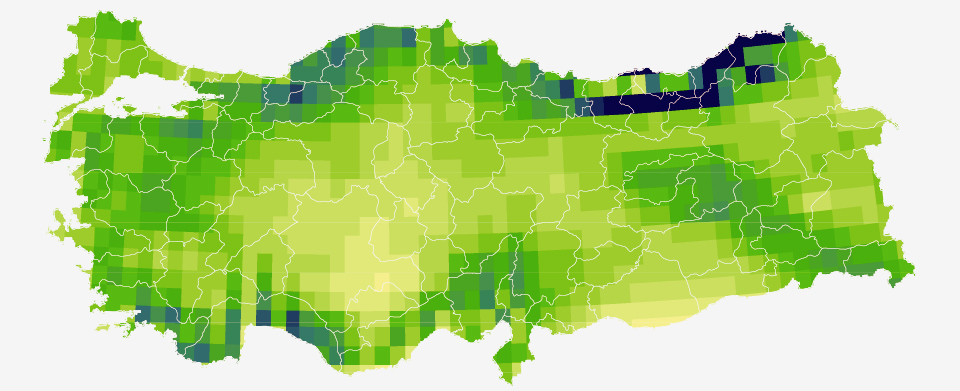 234.2 - 300 600.1 - 675 900.1 - 975 1.200.1 - 1.275 1.650.1 - 6.000
-
Model estimated precipitation for 2041-2070 (mm)
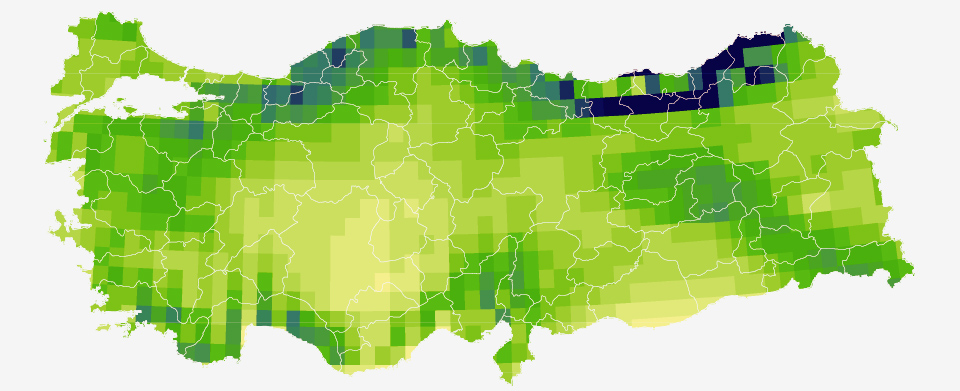 234.2 - 300 600.1 - 675 900.1 - 975 1.200.1 - 1.275 1.650.1 - 6.000
-
Model estimated precipitation for 2071-2099 (mm)
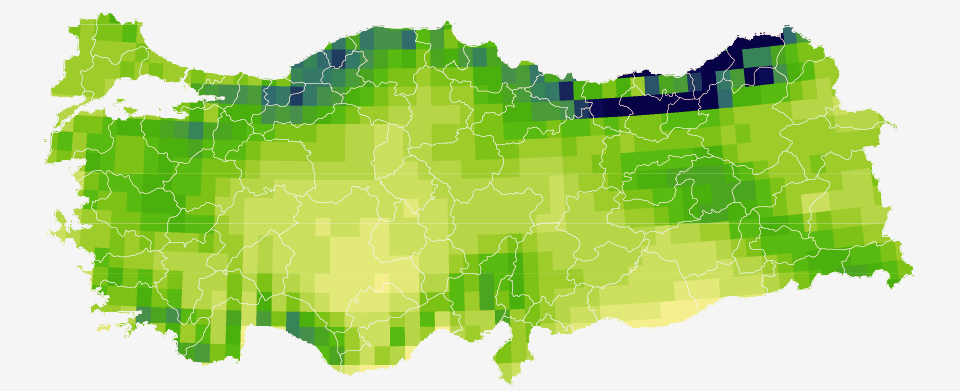 234.2 - 300 600.1 - 675 900.1 - 975 1.200.1 - 1.275 1.650.1 - 6.000
Precipitation
These maps show the model-estimated annual precipitation distribution in Turkey for three different periods, 1961-1990, 2041-2070, and 2071-2099. Turkey receives the lowest annual precipitation around Karaman in the south central plateau (below 300 mm) and its highest precipitation around Rize in the northeast (above 2,000 mm). Comparison of the model-estimated 1961-1990 precipitation with the observed precipitation for the same period suggests that the model does a good job in simulating precipitation in Turkey.
Comparison of future maps with the 1961-1990 map indicates that precipitation will decrease in the southern parts of Turkey, while it may increase in the northern parts. This shift can be observed more clearly in the change maps of (1961-1990) - (2041-2070), and (1961-1990) - (2071-2099).